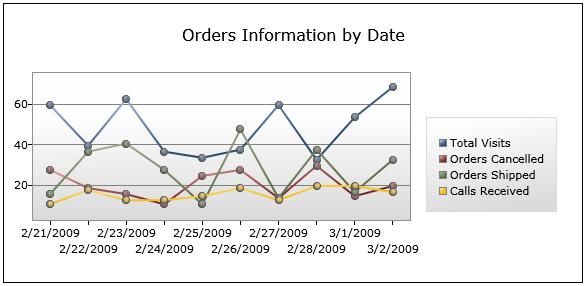
Lets say we have a chart like this

it kind of looks like too many lines and user doesnt have easy way to see the different trends or easily compare the different measures user wants.
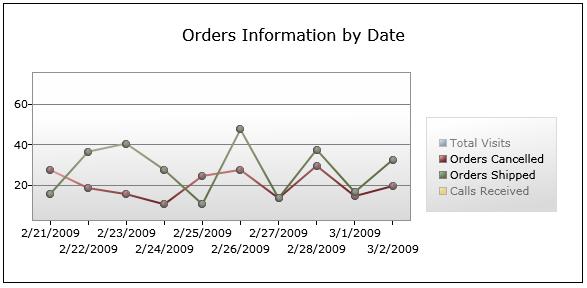
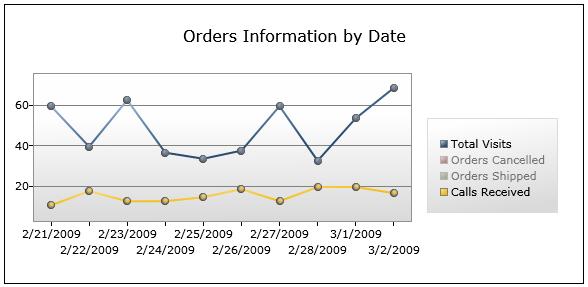
Showing and hiding a particular series will be nice addition to charts to allow the user to pick and choose what to see. we want the user to be able to click the legenditem to toggle the display of the series.


we will start adding a style for the LegendItem, the original style looks like this
<Style TargetType=”charting:LegendItem”>
<Setter Property=”IsTabStop” Value=”False” />
<Setter Property=”Template”>
<Setter.Value>
<ControlTemplate TargetType=”charting:LegendItem”>
<StackPanel Orientation=”Horizontal”>
<Rectangle Width=”8″ Height=”8″ Fill=”{Binding Background}”
Stroke=”{Binding BorderBrush}” StrokeThickness=”1″ Margin=”0,0,3,0″ />
<datavis:Title Content=”{TemplateBinding Content}” />
</StackPanel>
</ControlTemplate>
</Setter.Value>
</Setter>
</Style>
and we specify the style on the LineSeries like this
<charting:LineSeries LegendItemStyle=”{StaticResource LegendItemStyle}” Title=”Total Visits”
IndependentValueBinding=”{Binding OrderDate}”
DependentValueBinding=”{Binding Visits}” />
As we want to provide a way for the user to toggle the visibility of the Series. we will re-style the LegendItem to use a CheckBox for this sample
<Style x:Key=”LegendItemStyle” TargetType=”charting:LegendItem”>
<Setter Property=”IsTabStop” Value=”False” />
<Setter Property=”Template”>
<Setter.Value>
<ControlTemplate TargetType=”charting:LegendItem”>
<CheckBox Click=”CheckBox_Click” Cursor=”Hand” IsChecked=”true”
Content=”{TemplateBinding Content}” Tag=”{TemplateBinding Content}”>
<CheckBox.Template>
<ControlTemplate TargetType=”CheckBox”>
<StackPanel Orientation=”Horizontal”>
<Rectangle Width=”8″ Height=”8″ Fill=”{Binding Background}” Stroke=”{Binding BorderBrush}”
StrokeThickness=”1″ Margin=”0,0,3,0″ />
<datavis:Title Content=”{TemplateBinding Content}” />
</StackPanel>
</ControlTemplate>
</CheckBox.Template>
</CheckBox>
</ControlTemplate>
</Setter.Value>
</Setter>
</Style>
(After posting I realized that instead of binding again to Tag we could base our condition on the content itself. Too lazy to change the code now)
To start with, we want all the series to be shown so we set the IsChecked property to “true”.
we added a click handler also to checkbox in which we are going to check the IsChecked property and decide if we want the series to be shown or hidden
private void CheckBox_Click(object sender, RoutedEventArgs e)
{
CheckBox chk = (sender as CheckBox);
LineSeries ls = chart1.Series.Cast
().Where(s => s.Title.ToString() == chk.Tag.ToString()).ElementAtOrDefault(0);
if (chk.IsChecked.Value)
chk.Opacity = ls.Opacity = 1;
else
{
chk.Opacity = 0.5;
ls.Opacity = 0;
}
}
Very Nicely done.
Thank you
Doesn’t seem as if there’s a convenient way to use this for the general case of having multiple charts on the same screen, or at least it’s not obvious how that would be done.
Thanks for the jumpstart, though, it’s much appreciated.
Not sure, I understand what you are trying to do
Well, you have a reference to the chart hard-coded into the checkbox event handler (chart1). Since my page has four charts on it, it would seem that I can’t use the LegendItemStyle as-is on each chart, and I’m too new to Silverlight to know how to accomplish this without literally copying and pasting the style for each chart 😦
you could modify the function for checkbox click like below, so that chart name is not hard coded and will work for multiple charts
private void CheckBox_Click(object sender, RoutedEventArgs e)
{
CheckBox chk = (sender as CheckBox);
Chart ch = GetParent(chk);
LineSeries ls = ch.Series.Cast().Where(s => s.Title.ToString() == chk.Tag.ToString()).ElementAtOrDefault(0);
if (chk.IsChecked.Value)
chk.Opacity = ls.Opacity = 1;
else
{
chk.Opacity = 0.5;
ls.Opacity = 0;
}
}
//Add this function in your code behind
public T GetParent(DependencyObject obj) where T : DependencyObject
{
DependencyObject parent = VisualTreeHelper.GetParent(obj);
while (parent != null)
{
if (parent.GetType() == typeof(T))
break;
else
parent = GetParent(parent);
}
return parent as T;
}
Excellent. I had tried looking at the .Parent property (which is always null), but had not known about the VisualTreeHelper class. Thanks a bunch!
you are welcome
VERY HELPFUL. I needed to use legend items to remove the series from the chart and this worked BEAUTIFULLY! Thanks so much.
Great post, helped me with a problem with syncing up lineseries colors with an external control. I was able to modify the legend style to meet my needs and merge that with your demo and it’s workign well. Thanks.
Thanks
Very useful post. Please would you show me how to extend your example to a chart that has a combination of line and column series. Thanks
ok, I figured it out. Just had to change
Series ls = TheChart.Series.Cast().Where(s => s.Title.ToString() == chk.Tag.ToString()).ElementAtOrDefault(0);
to
Series ls = TheChart.Series.Cast().Where(s => s.Title.ToString() == chk.Tag.ToString()).ElementAtOrDefault(0);
I would like to extend this ‘Showing/Hiding Series’ functionality to a chart that has both the new StackedColumnSeries (Silverlight 4) and LineSeries. Any tips?
Hi,
I did not play around with stacked charts, wont a similar approach work. Are the series pointing to the same data, what issues are you having
Originally I had 2 line and 3 column series in a single chart and the show/hide legend check boxes were working fine. Then with the new release of Silverlight 4, I changed my 3 column series to be stacked column series. Now when I click on the legend checkbox I get error :
“Unable to cast object of type ‘System.Windows.Controls.DataVisualization.Charting.StackedColumnSeries’ to type ‘System.Windows.Controls.DataVisualization.Charting.Series’.”
you have to add styles for legend and legenditem. the checkbox will go in the legenditem template and codebehind will look like this
private void CheckBox_Click(object sender, RoutedEventArgs e)
{
CheckBox chk = (sender as CheckBox);
SeriesDefinition ls = chart1.Series.Cast<StackedColumnSeries>().First().SeriesDefinitions.Where(s => s.Title.ToString() == chk.Tag.ToString()).ElementAtOrDefault(0);
if (chk.IsChecked.Value)
chk.Opacity = ls.Opacity = 1;
else
{
chk.Opacity = 0.5;
ls.Opacity = 0;
}
}
thing is Opacity is not getting reflected correctly. we should come up with something. I will update if I find a way
Thanks for this Lee. I have tried out your code for the StackedColumnSeries and also did not get the Opacity to work. Also tried the Visibility property but that didn’t work either.
Also I need to extend this to cope with both line series and stacked column series in the same chart. Any advice on this would be much appreciated.
Hi,
looks like the only way it might work, is to have not show the legend for the stackedcolumnseries and base our logic on lineseries and programatically add/remove the seriesdefinitions. opacity wont work as the points are laid out on canvas, so we have to literally remove the series definition
Hi,
thanks for this great article. But I need your help. I have several charts on several TabItems. The Charts show the same Informations but they use different timespans. Therefor i need to synchronize the LegendItems and LineSeries. I try to access to the differen checkboxes in the charts – but it doesn’t work. Have you an idea? Thank you
Hi,
Could you send me a sample of what you are trying to do?
Your solution is the basis and I write down just the changes:
1. include dll and register namespace:
xmlns:extended=”clr-namespace:System.Windows.Controls;assembly=System.Windows.Controls”
2.change xaml-file
3. Append to constructor:
(this.chart2.Series[0] as LineSeries).ItemsSource = DataItems;
(this.chart2.Series[1] as LineSeries).ItemsSource = DataItems;
(this.chart2.Series[2] as LineSeries).ItemsSource = DataItems;
(this.chart2.Series[3] as LineSeries).ItemsSource = DataItems;
after
(this.chart1.Series[3] as LineSeries).ItemsSource = DataItems;
When I hide Series “Total Visits” in TabItem “View 1” it should hide also in TabItem “View 2”.
I hope you will understand my intension:-)
WordPress has some problems with xaml. Can you send me an email please. I will send back my project-code to your adress. Thank you
Guys am also facing some problem with Stackedcolumn series .. can you please mail me the code
Hi,
we did not find a solution, the series items are hosted in a canvas, so we have to come up with a way to size the item to 0(when we dont want to see the series) and back to original value (when the series is visible) as opacity wont work
I’m having the same issue. If the opacity won’t work, then why is it there?
I tried removing the series, but the series definition that is stacked on top of the removed series falls to 0 and starts from there. So that method won’t work.
It wont work when the series are stacked
Thanks,That’s great. Only problem I have is the the legend series title disappeared after I apply this template. Any idea?
Hi,
Do you mean LegendTitle attribute on the Chart when specified shows up on the top of the Legend?. if so I tried and seems to show up fine.
No, I mean the title of each series in the legend.
Hi,
Could you send me a link to the sample project. I can take a look. May be there is something I am missing in the style
Any Solutions to the dissaperaing legend items? Please Help
Ok proplrm solved…
change
chk.Opacity = ls.Opacity = 1;
to
chk.Opacity = 1;
ls.Opacity = 1;
Hi,
Thanks for this post, I learnt a lot from the code 🙂
Could you please tell me from where you found the original style of the Legend item? Because I would like to do something similar (change the style) to other controls, but I don’t know what the original looks like to begin with.
Thanks 🙂
you can open the project in blend and you can start looking at legendtemplate
Oh I see. I’m actually using the WPF, that’s why I’m not using Blend. I’ll see how I can acquire it (from what I understand the free version is a trial version. I’m just using it for a small project, though, so that should be find :D)
Thanks very much for the fast reply.
Hi lee,
Thanks for your post.
this code work beautifully.
let me know something, after i unckecked one of the legenditem, one line series disappeard but tooltip stil remain when mouse cousor point the old place even line hide…
let me know how to remove the tooltip while unckeck the specific lineseries..
thanks..
hi All!
Very interesting! but can we done the same things without writnig code in code behind’fiel.
just by binding visibility or Opacity value to the checkbok.IsChecked property in the legend template? (of corse with converter :D)
is it possible?
thanx all
The same result can be obtained without setting the tag. This is generic and works for multiple charts.
private void CheckBox_Click(object sender, RoutedEventArgs e)
{
CheckBox chk = (sender as CheckBox);
if (chk != null)
{
UIElement parent = (UIElement)VisualTreeHelper.GetParent(chk);
LegendItem legendItem = parent as LegendItem;
if (legendItem != null)
{
LineSeries ls = legendItem.Owner as LineSeries;
if (ls != null)
{
if (chk.IsChecked != null && chk.IsChecked.Value)
{
chk.Opacity = ls.Opacity = 1;
}
else
{
chk.Opacity = 0.5;
ls.Opacity = 0;
}
}
}
}
}